How to Estimate Take-Home Pay
Your offer letter says $100,000. Your friend says you'll "lose about a third to taxes." Your dad says "it depends." None of these are useful when you're deciding whether to take the job, move cities, or sign the apartment lease.
Estimating take-home pay isn't hard, but it does require following a specific sequence. Mix up the order — for example, applying federal tax brackets to your gross instead of your taxable income — and you'll be off by thousands. This guide walks through the five-step process with a $100,000 single example, then shows how the math shifts when you change one variable.
The five steps in order
- Start with gross: Annual salary or wages before any deductions.
- Subtract pre-tax deductions: Traditional 401(k), HSA, FSA, pre-tax health insurance premiums.
- Subtract the standard or itemized deduction: Standard for most filers; itemized only if it exceeds the standard.
- Apply federal income tax brackets: To taxable income, not gross.
- Apply FICA and state tax: FICA on gross wages (with limits); state tax usually on taxable income similar to federal.
Each step depends on getting the previous one right. Skip ahead and you'll over- or under-estimate.
Step 1: Gross income
Gross is your salary before anything is taken out. For a salaried worker, that's the offer letter number: $100,000 in our example. For hourly workers, multiply your hourly rate by expected annual hours — Salary to Hourly Converter works in reverse for this.
What's not in gross for take-home estimating purposes:
- Employer 401(k) match (it's compensation but doesn't pass through your paycheck as cash)
- Employer-paid health insurance premium (same)
- The employer half of FICA (the employer pays it; you don't see it)
What is in gross:
- Base salary
- Anticipated bonus (handle separately for tax purposes, but include in annual gross)
- Commissions
- Any other regular wage compensation
For our worked example: $100,000 gross.
Step 2: Subtract pre-tax deductions
Pre-tax deductions come off the top before income tax is calculated. The big ones:
- Traditional 401(k) contributions: 2026 limit is $23,500 for under-50, $31,000 with catch-up.
- HSA contributions: $4,300 single / $8,550 family in 2026.
- FSA: Up to $3,200 for healthcare FSA.
- Pre-tax health insurance premium: Often $2,000-6,000/year for the employee share.
- Pre-tax commuter benefits: Up to $325/month in 2026.
- Traditional IRA: Not pre-tax through payroll, but deductible at tax time if you qualify.
These don't all reduce every tax. Specifically:
- 401(k), HSA, FSA, and health premiums reduce both federal income tax and (in most cases) state income tax.
- 401(k) does not reduce FICA (Social Security and Medicare).
- HSA and health premiums do reduce FICA.
For our example, assume our $100k single filer contributes:
- 401(k): $10,000 (a 10% contribution)
- Pre-tax health premium: $2,400
- HSA: $2,000
Pre-tax deductions total: $14,400
This brings federal/state taxable income down toward $85,600, but FICA is calculated on a different base (more on that in step 5).
Step 3: Subtract the standard deduction
The 2026 standard deduction is:
- $14,600 for single filers
- $29,200 for married filing jointly
- $21,900 for head of household
Most people take the standard deduction. You'd only itemize (using Schedule A for things like large mortgage interest, state and local taxes capped at $10,000, big charitable contributions, etc.) if your itemized total exceeds the standard.
For our $100k single example:
- Gross: $100,000
- Less pre-tax deductions: −$14,400
- Less standard deduction: −$14,600
- Federal taxable income: $71,000
Step 4: Apply federal income tax brackets
Federal tax is calculated on a marginal basis — each bracket's rate only applies to dollars within that bracket. Here are the relevant 2026 single-filer brackets (rates apply to taxable income, not gross):
- 10% on income up to about $11,925
- 12% from $11,925 to about $48,475
- 22% from $48,475 to about $103,350
- 24% from $103,350 to about $197,300
- And higher brackets above that
The 22% bracket starts at $47,150 of taxable income for single filers under the post-2026 reset, depending on annual inflation adjustments. For planning purposes, treat the boundary as in the high $40k range.
For our $71,000 taxable income:
- First $11,925 at 10% = $1,193
- Next ~$36,550 at 12% = ~$4,386
- Remaining ~$22,525 at 22% = ~$4,956
Federal income tax: ~$10,535
Our effective federal income tax rate is $10,535 / $100,000 = 10.5% — much lower than the "22% bracket" sounds. This is the most common confusion in take-home math: people see "22% bracket" and assume 22% of their whole paycheck is going to federal tax. It isn't.
Step 5: Apply FICA and state tax
FICA
FICA is two taxes bundled:
- Social Security: 6.2% on wages up to the 2026 wage base of $176,100.
- Medicare: 1.45% on all wages, plus an additional 0.9% on wages over $200,000 (single) or $250,000 (joint).
FICA is calculated on a different base than income tax. It applies to gross wages minus HSA, FSA, and pre-tax health premiums, but not minus your 401(k) contribution. So:
- FICA wages = $100,000 − $2,000 (HSA) − $2,400 (health) = $95,600
- Social Security: 6.2% × $95,600 = $5,927
- Medicare: 1.45% × $95,600 = $1,386
- FICA total: $7,313
State income tax
State tax varies widely. Some no-tax states (Texas, Florida, Washington, Tennessee, Nevada, South Dakota, Wyoming, Alaska, New Hampshire on interest-only). Others have flat rates (Colorado ~4.4%, Illinois 4.95%, Utah 4.65%). Many use brackets similar to federal but at lower rates.
For our example, let's split into two scenarios:
- In Texas (no state tax): State tax = $0
- In California (progressive, top bracket 13.3%): For $71,000 of taxable income, an effective rate of roughly 4-5% on taxable income → ~$3,000-3,500
Putting it together: the $100k single example
In Texas
- Gross: $100,000
- 401(k): −$10,000 (goes to retirement account, not your bank but still yours)
- HSA: −$2,000
- Health premium: −$2,400
- Federal income tax: −$10,535
- FICA: −$7,313
- State: −$0
Net to bank account: ~$67,752 / year, or about $5,646/month.
Take-home as % of gross: 67.8%. But that's only the cash; the 401(k) and HSA money is also yours, just tied up. Including them, your total "you" money is $79,752, or 79.8% of gross.
In California
Same as above plus ~$3,200 state tax: $64,552 / year, or $5,379/month.
Take-home cash %: 64.6%.
The "30% rule" — when it works and when it doesn't
A widely-quoted rule of thumb is "expect to lose 30% to taxes." For our $100k Texas example, total taxes (federal + FICA + state) are $17,848 — only 17.8% of gross. The 30% rule is way off here.
Why the discrepancy? The 30% number includes income tax + FICA + state for a higher-income, higher-tax-state scenario, often without accounting for pre-tax deductions. It's a fine guess for a $150k+ earner in California, but wildly wrong for a $60k earner in Texas.
A better mental model for back-of-napkin work:
| Profile | Total tax burden as % of gross |
|---|---|
| Lower-mid income (under $60k), no-tax state | 15-20% |
| Mid income ($60-120k), no-tax state | 18-25% |
| Mid income, mid-tax state | 22-28% |
| Higher income ($150k+), high-tax state (CA/NY/NJ) | 30-40% |
| High income ($300k+), high-tax state | 35-45% |
If you want a more accurate number, Take-Home Pay Calculator does the math for your state and filing status.
Common shortcuts and the errors they introduce
Shortcut 1: "Multiply gross by 0.7"
Fine for high earners in high-tax states. Off by 5-15 points for everyone else. Not bad for a 30-second sanity check; bad for a budget.
Shortcut 2: "Just subtract the federal bracket"
Multiplying gross by your top bracket rate over-states tax dramatically because brackets are marginal. A 22%-bracket earner has an effective federal rate closer to 12-14%.
Shortcut 3: "Forget FICA"
FICA is 7.65% — bigger than most state taxes. Ignoring it is a major error.
Shortcut 4: "Use a paycheck calculator from one of your coworkers' states"
State variation is the single biggest swing in take-home pay between US workers. The same $100k salary takes home ~$3,500 less in California than Texas, every year. Always recalculate by state.
What changes the answer most
If you're trying to predict take-home for a raise, a move, or a new job, the variables that move the number meaningfully:
- State income tax: Moving from California to Texas or Florida is often the largest single tax change you'll ever experience without changing your salary.
- Filing status: Joint filers benefit from larger brackets and a $29,200 standard deduction. The marriage penalty exists at high incomes but doesn't kick in until well into six figures.
- Pre-tax retirement contributions: Every dollar of traditional 401(k) is a dollar that defers tax. Maxing out shifts your tax owed meaningfully.
- HSA contributions: HSA dollars are tax-deductible for federal, state, AND FICA. They're the most tax-advantaged dollar in the US tax code.
For comparing raises specifically — where the marginal math matters more than total take-home — Raise / Promotion Calculator handles the bracket-jump scenarios.
When to stop estimating and ask a CPA
For most W-2 employees with a straightforward situation, the five-step process above is good to within a few percent. You probably don't need professional help for the estimate; you might want it for the actual return if you have:
- RSU or stock option income
- Side business or freelance income (1099)
- Rental property
- Major life event (marriage, divorce, new baby, big move) mid-year
- Multiple state residencies in the same year
For everyone else: the math is just arithmetic. The hard part is getting the order right. Now you have the order.
Run the numbers
Everything below came out of this site's own Salary to Hourly Converter. The figures are not quoted from anywhere else: each row is one run of the same calculation the tool page performs, using August 2026 rules. Put the same inputs in and you will get the same output.
How the result moves with salary
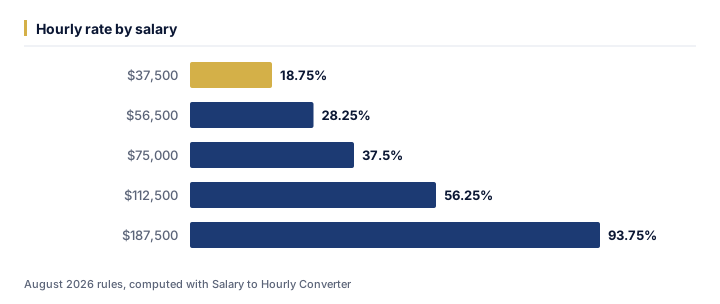
We ran 5 values of salary through the calculator and left every other input at its default. As of August 2026, the output was:
| Salary ($) | Hourly rate (%) | Monthly pay ($) | Biweekly pay ($) |
|---|---|---|---|
| 37,500 | 18.75% | 3,125 | 1,442.31 |
| 56,500 | 28.25% | 4,708.33 | 2,173.08 |
| 75,000 | 37.5% | 6,250 | 2,884.62 |
| 112,500 | 56.25% | 9,375 | 4,326.92 |
| 187,500 | 93.75% | 15,625 | 7,211.54 |
Running salary from $37,500 up to $187,500 moves hourly rate from 18.75% to 93.75% — a spread of 75%. That gap is the part a single headline rate never shows.
The same runs seen through monthly pay
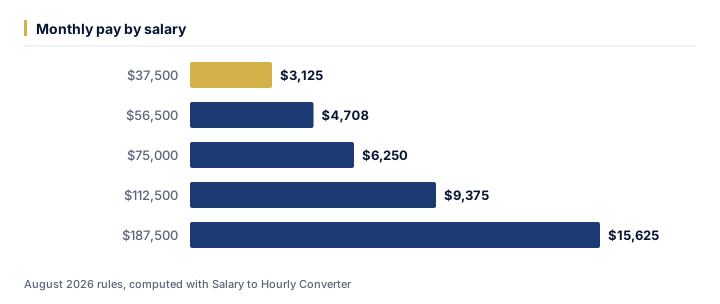
At $37,500, monthly pay works out to $3,125; at $187,500 it is $15,625. Looking only at hourly rate tends to understate how much the outcome shifts across that range.
One example, straight from the API
The middle row above (salary = $75,000) is not a rounded illustration — it is exactly what /api/v1/tools/salary-to-hourly-converter/calculate returns for that input, August 2026 rules:
{
    "tool": "salary-to-hourly-converter",
    "inputs": {
        "salary": 75000,
        "hoursPerWeek": 40,
        "weeksPerYear": 50
    },
    "result": {
        "hourly_rate": 37.5,
        "monthly_pay": 6250,
        "biweekly_pay": 2884.62,
        "weekly_pay": 1442.31,
        "daily_pay": 300,
        "hours_per_year": 2000
    }
}
Assumptions behind these figures
| Input | Value |
|---|---|
| Salary | $75,000 |
| Hours per week | $40 |
| Weeks per year | 50 years |
| As of | August 2026 |
| Method | identical to /tools/salary-to-hourly-converter |
Rates, thresholds and typical costs change over time; the numbers above are accurate as of August 2026, not a permanent guarantee. For your own situation, open the Salary to Hourly Converter and enter your real numbers — the calculator runs the same code that produced every figure on this page.