How to Calculate Stock Option Worth
Stock options are the most misunderstood line item in compensation packages. Recruiters tend to quote them in nominal dollars — "this grant is worth $300,000" — but that number is theoretical, conditional, and tax-bombed in ways that change the real value by 40-60%. To make sense of an option offer, you need to understand five concepts: strike price, fair market value, spread, ISO vs NSO, and the AMT.
This guide walks through each, then gives three worked examples covering the most common scenarios employees face.
The Five Concepts You Need
1. Strike price
The strike price (also called the exercise price) is what you pay per share to convert your option into actual stock. It's set on the grant date — usually equal to the fair market value at that moment. If the company grows after that, the strike stays fixed, and your gain comes from the difference between strike and current value.
2. Fair market value (FMV)
For public companies, FMV is the trading price on the relevant date. For private companies, FMV is the most recent 409A valuation, an independent appraisal that companies are required to update annually (or after material events). The 409A is intentionally conservative — it's the IRS-safe-harbor price, not the price a sophisticated investor would actually pay.
3. Spread
Spread is the per-share gap between FMV and strike at the moment of exercise:
Spread per share = FMV at exercise - Strike price
Total spread     = Spread per share × Shares exercised
The spread is what the IRS taxes. Whether it's taxed as ordinary income or capital gains depends on what kind of option you have — and what you do next.
4. ISO vs NSO
There are two major flavors of employee stock options under U.S. tax law:
- Incentive Stock Options (ISOs) — Available only to employees. Carry preferential tax treatment if certain holding-period rules are met. Subject to a $100,000/year vest-value limit; anything above that is treated as NSO.
- Non-Qualified Stock Options (NSOs) — Available to employees, contractors, advisors, and board members. Spread at exercise is taxed as ordinary income, regardless of what you do next.
The label matters enormously for tax. ISOs can convert ordinary-income-rate gains into long-term capital-gains-rate gains if you hold long enough. NSOs cannot.
5. AMT (Alternative Minimum Tax)
Here's where ISO exercises get tricky. When you exercise an ISO and hold the shares (rather than selling immediately), the spread isn't taxed as ordinary income for regular tax purposes — but it is a preference item for the Alternative Minimum Tax. If the spread is large enough, you can owe AMT in the year of exercise even though you haven't sold any shares and have no cash from the transaction.
The AMT rate is 26% on the first $232,600 of AMT income (2026 figure) and 28% above. It's a parallel tax system; you pay the higher of regular tax or AMT. Anyone exercising a large ISO position should run an AMT projection before pulling the trigger.
Use Stock Options Calculator to model spread, exercise cost, and tax under different scenarios.
Three Worked Examples
Example 1: NSO Exercise and Hold
You're granted 10,000 NSOs at a $5 strike. Three years later, the company has gone public and the stock trades at $40. You decide to exercise all 10,000 and hold them.
At exercise:
Exercise cost: 10,000 × $5 = $50,000 (cash out of pocket)
Spread:        10,000 × ($40 - $5) = $350,000
That $350,000 spread is ordinary income, reported on your W-2 in the year of exercise. You owe:
- Federal income tax at your marginal rate (let's say 35% for a high earner)
- FICA: 1.45% Medicare (no cap, plus 0.9% Additional Medicare on excess)
- State income tax (varies — let's say 5%)
- Total tax bill: roughly $350,000 × 41% = $143,500
Plus the $50,000 exercise cost. So you spent $193,500 to acquire shares now worth $400,000. Your net economic position from exercise: $400,000 - $193,500 = $206,500.
If you later sell at $60/share, 18 months after exercise:
Proceeds:   10,000 × $60 = $600,000
Cost basis: 10,000 × $40 = $400,000   (FMV at exercise)
Gain:       $200,000 long-term capital gain
Long-term cap gains tax at 20% (top federal bracket) = $40,000. Plus state. The total stack: ordinary income tax at exercise + long-term cap gain on the appreciation after exercise. NSOs are clean but don't offer any rate arbitrage.
Example 2: ISO Qualifying Disposition
Same setup: 10,000 ISOs at $5 strike, exercised when FMV is $40. But now you wait — you hold the shares for two years from grant date and one year from exercise date (the ISO holding period rules). Then you sell at $60.
At exercise:
Exercise cost: 10,000 × $5 = $50,000
Spread:        10,000 × ($40 - $5) = $350,000
For regular tax purposes, the spread is not taxed in the year of exercise. For AMT purposes, it is — see Example 3.
At sale (qualifying disposition):
Proceeds:   10,000 × $60 = $600,000
Cost basis: 10,000 × $5  = $50,000   (the original strike)
Gain:       $550,000 long-term capital gain
Long-term cap gains at 20% = $110,000 federal. Compare this to the NSO version, where you paid 35% ordinary tax on $350,000 PLUS 20% LTCG on $200,000 = $122,500 + $40,000 = $162,500.
ISO qualifying disposition saves $52,500 in this example, if you can hold long enough and if AMT doesn't claw it back.
Example 3: ISO Exercise with AMT Impact
Same ISO grant, same $40 FMV at exercise. You exercise and hold. Your other income for the year is $250,000 of W-2 wages.
Regular tax: No income added for the ISO exercise (you're holding, not selling).
AMT calculation:
AMTI = Regular taxable income + ISO spread + other preferences
     ≈ $250,000 (less std deduction adjustment) + $350,000 spread
     ≈ $580,000 AMTI (simplified)
After the AMT exemption phase-out (the exemption phases out fast at higher incomes), most of that $350,000 spread becomes taxable at 26-28% under AMT.
Estimated AMT add-on tax: roughly $90,000-$100,000 owed in the year of exercise, even though you haven't sold a single share and have no cash from the exercise.
The good news: the AMT you paid becomes an AMT credit that you can carry forward and recover in future years when your regular tax exceeds your AMT. The bad news: the credit may take years to fully recover, and many people don't have the liquidity to write a $100,000 check the April after exercise.
This is the famous "ISO trap" that wiped out employees during the 2000 dot-com bust — they exercised ISOs when share prices were sky-high, triggering AMT on huge paper gains, then watched the shares crater before they could sell. They owed real cash on phantom income.
Decision Framework: When to Exercise
The right exercise strategy depends on three variables:
- Cash on hand — Can you afford the strike-price cash outlay and the potential tax bill?
- Risk tolerance — Are you comfortable concentrating wealth in your employer's stock?
- Time horizon — How long until you expect a liquidity event (sale, IPO)?
A common framework:
- Early exercise (immediately at grant) — If the strike equals FMV, spread is zero, so no tax and the long-term clock starts at exercise. Best when the company is early-stage and you believe in massive future growth.
- Exercise in tranches — Spread the AMT exposure across multiple tax years to avoid one giant AMT spike.
- Exercise and hold — Make the long-term holding-period clock start. Only do this if you can afford both exercise cost and any AMT.
- Exercise and sell immediately (cashless or same-day) — Locks in the spread as ordinary income (for NSOs) or as a disqualifying disposition (for ISOs, losing the favorable treatment) but eliminates downside risk on the shares.
- Don't exercise — Valid if the company hasn't IPO'd, the strike is high relative to a realistic exit, or you've already left the company and have no inside information.
For comparing options-heavy offers against salary-heavy or RSU-heavy alternatives, run the numbers through RSU Calculator for the RSU side and Take-Home Pay Calculator for the base salary side. Then add the option valuation separately, with a discount for risk.
Discounting Private-Company Options
For private companies, the stated grant value is almost never the realistic value. Apply these discounts:
- Illiquidity discount — 20-40% off. Even if shares vest, you can't easily sell them until an IPO or acquisition.
- Risk-of-failure discount — 30-70% off, depending on the company's stage. Most startups fail; even successful ones often deliver mediocre exits.
- Dilution discount — 10-20% off. Future funding rounds will issue more shares, diluting your percentage.
A common heuristic for early-stage private-company options: treat the stated face value at roughly 25-50% of nominal for offer-comparison purposes. A "$300,000 option grant" is more like $75,000-$150,000 in expected value.
83(b) Election: A Quick Mention
If you early-exercise unvested options (allowed in some plans), you can file an 83(b) election within 30 days. This locks in the spread as $0 at exercise (since strike = FMV at grant) and starts the long-term capital gains clock immediately. If the company succeeds, you've converted what would have been ordinary income into long-term capital gains.
Risk: if the company fails or you leave before vesting, you've paid for shares you'll forfeit. The 83(b) is irreversible.
Final Thoughts
Stock options can be transformative or disappointing — sometimes both, in sequence. The math is workable, but you need to slow down and think about each piece:
- What kind of option is it (ISO vs NSO)?
- What's the strike, what's the FMV, what's the spread?
- What's the tax treatment under regular tax and AMT?
- Can I afford the exercise cost and any tax bill?
- What's the realistic probability that the shares are worth what the grant says?
Run scenarios before you commit. The wrong exercise decision can cost six figures. The right one can change your life.
This article is educational and not a substitute for personal tax or financial advice. Stock option taxation interacts with AMT, state law, and your specific income picture in complex ways. Consult a qualified CPA, ideally one with equity-compensation experience, before exercising any significant grant.
Run the numbers
Everything below came out of this site's own Take-Home Pay Calculator. The figures are not quoted from anywhere else: each row is one run of the same calculation the tool page performs, using August 2026 rules. Put the same inputs in and you will get the same output.
How the result moves with salary
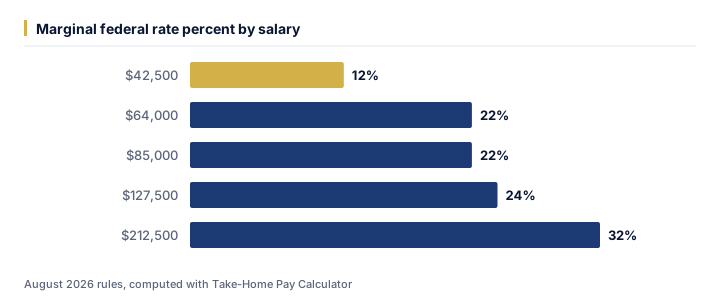
We ran 5 values of salary through the calculator and left every other input at its default. As of August 2026, the output was:
| Salary ($) | Marginal federal rate percent (%) | Effective tax rate percent (%) | Take home annual ($) |
|---|---|---|---|
| 42,500 | 12% | 17.1% | 35,245.07 |
| 64,000 | 22% | 20.4% | 50,950.64 |
| 85,000 | 22% | 24.8% | 63,897.41 |
| 127,500 | 24% | 29.7% | 89,596.16 |
| 212,500 | 32% | 33.4% | 141,456.96 |
Running salary from $42,500 up to $212,500 moves marginal federal rate percent from 12% to 32% — a spread of 20%. That gap is the part a single headline rate never shows.
The same runs seen through effective tax rate percent
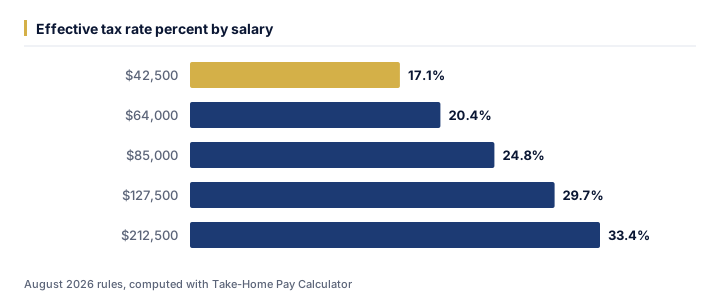
At $42,500, effective tax rate percent works out to 17.1%; at $212,500 it is 33.4%. Looking only at marginal federal rate percent tends to understate how much the outcome shifts across that range.
One example, straight from the API
The middle row above (salary = $85,000) is not a rounded illustration — it is exactly what /api/v1/tools/take-home-pay-calculator/calculate returns for that input, August 2026 rules:
{
    "tool": "take-home-pay-calculator",
    "inputs": {
        "salary": 85000,
        "filing": "single",
        "state": "CA",
        "contrib_pct": 0,
        "other_pre_tax": 0
    },
    "result": {
        "take_home_annual": 63897.41,
        "take_home_monthly": 5324.78,
        "take_home_biweekly": 2457.59,
        "federal_tax": 10541,
        "fica": 6502.5,
        "state_tax": 4059.09,
        "pretax_401k": 0,
        "federal_taxable": 70400,
        "marginal_federal_rate_percent": 22,
        "effective_tax_rate_percent": 24.8
    }
}
Assumptions behind these figures
| Input | Value |
|---|---|
| Salary | $85,000 |
| Filing | Single |
| State | Ca |
| Contrib pct | 0% |
| Other pre tax | $0 |
| As of | August 2026 |
| Method | identical to /tools/take-home-pay-calculator |
Rates, thresholds and typical costs change over time; the numbers above are accurate as of August 2026, not a permanent guarantee. For your own situation, open the Take-Home Pay Calculator and enter your real numbers — the calculator runs the same code that produced every figure on this page.